The challenge: monitor in real-time the presence of people in a limited surface area
During the patron saint festivities of San Miguel in the municipality of Las Rozas (Madrid), thousands of people attend the fairgrounds and surrounding areas, especially at night, when concerts and various events are held.

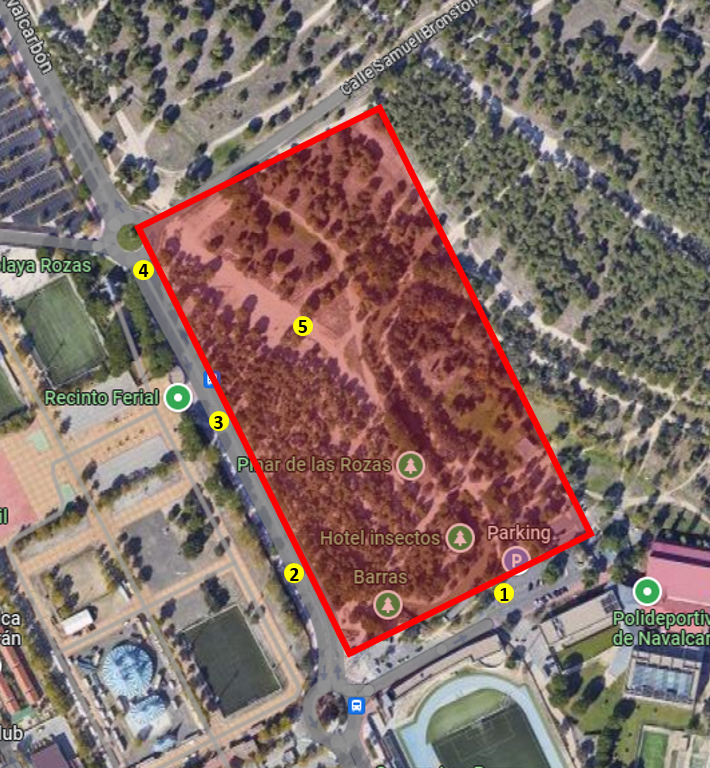
The deployment carried out by Galgus

José de la Uz, Mayor of Las Rozas
“In Las Rozas we know that technology is a fundamental ally to improve the quality of life in the city. That is why we put the city at the service of companies and startups with valuable ideas and projects to improve services to citizens. Thanks to good work of the professionals and technological solution of eSmartIT and its partner Galgus, we have achieved the objective of improving the security of citizens attending the 2023 San Miguel Festivities in Las Rozas”
Results achieved
With this solution, the Local Police of Las Rozas were able to keep the Navalcarbón Dehesa under surveillance at all times, being able to issue the necessary alerts and act accordingly.
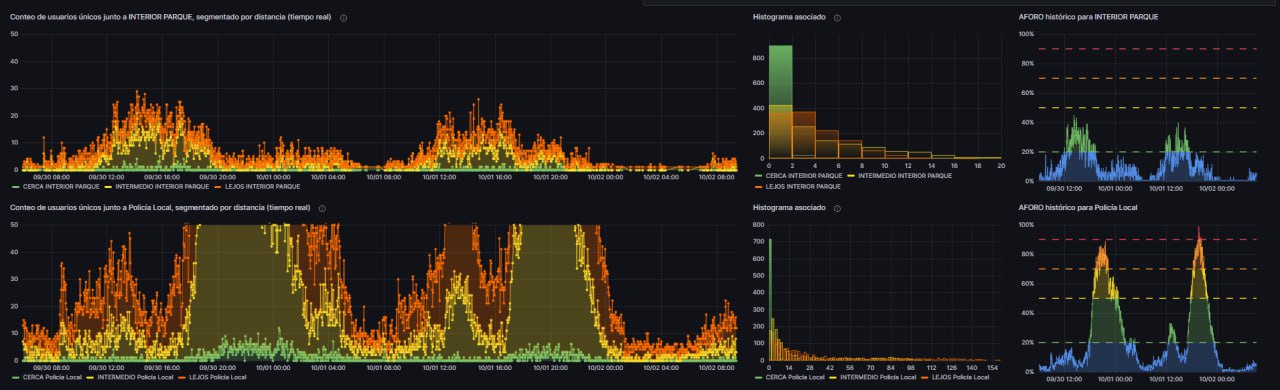
Additionally, they obtained valuable information about the behaviour of the people who attended the festivities.
Among this data, we could also gather unique users by area, days, and hours.
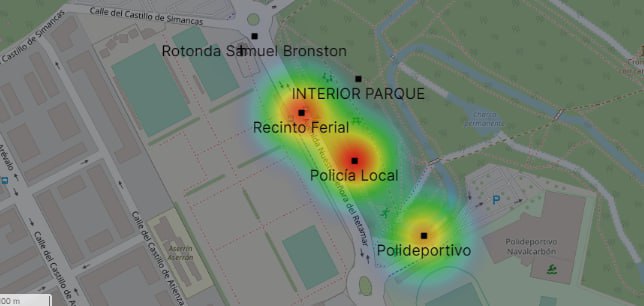
They also had available the graphic representation in heat maps of the density of devices at each analysis point.
They also had repeat visit ratios and average stay times.
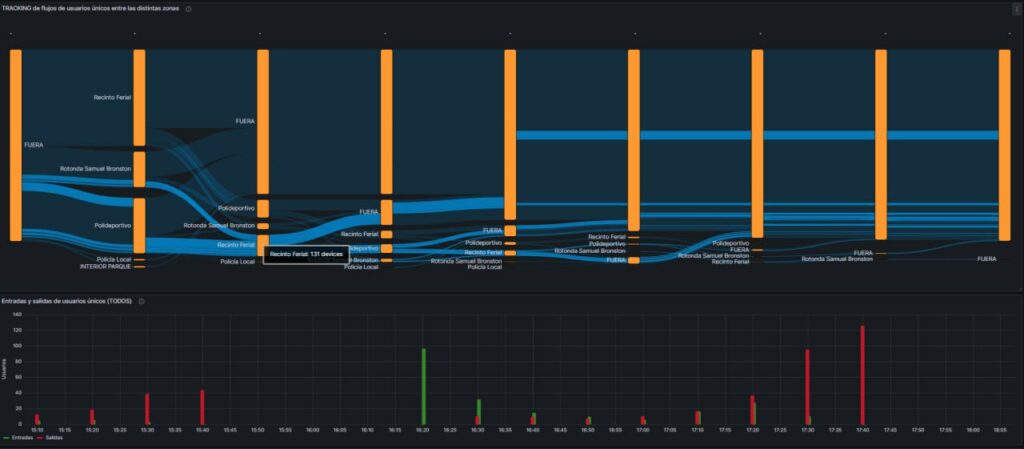
On the other hand, it was possible to capture and analyse the routes and movement of people (citizen journey).
Our solution also made possible to activate communication campaigns upon registration through a QR code to a captive portal.
A project that has been a success, fulfilling its objective of ensuring the safety of all those who enjoyed these festivities and of which we hope to give you more details soon.
Featured Webinar
Webinar ON DEMAND
Location Analytics as a
Key Tool for Making Cities Safer
Are you interested in applying this solution?
Contact us
Fill out the form and speak to our team to know where our technology can take you to control monitored areas.