What’s the aim?
To visualize graphically interesting information of the network depending on the position of the connected devices.
What is it?
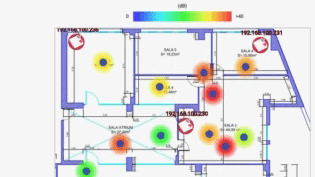
This ” Real-time Signal Strength Heatmap” feature does the following: Once the CHT system is able to locate most devices in a WiFi network, its estimated position can be matched with other interesting network metrics to build real-time heatmaps that show interesting information.
What is it for?
This allows the network administrator to display in real time the network quality metrics, such as signal quality (related to network coverage), connection mode (related to device capabilities), modulation used (related to transmission speed).
When?
This functionality is already in the product (Q9) for the KPIs connection mode, MCS and SNR. We have in roadmap, in addition, to use the data record in the Cloud Manager to be able to interpolate and to draw the heatmap in all the zones that surround to the WiFi network (not only in the points where there are connected devices).